Countries used in the analysis, returns and performance of EBI
Countries / regions considered (41 Morningstar categories)
Advanced Economies (24) |
Emerging Markets (8) |
Regions (9) |
Austria; Australia & New Zealand; Canada; Denmark; France Large Cap; France Mid & Small Cap; Germany Large Cap; Germany Mid & Small Cap; Italy; Japan Large Cap; Japan Mid & Small Cap; Korea; Netherlands; Norway; Singapore; Spain; Sweden; Switzerland Large Cap; Switzerland Mid & Small Cap; UK Large Cap; UK Mid & Small Cap; USA Large Cap Growth; USA Large Cap Value; USA Small Cap |
Brazil; China; Hong Kong; India; Indonesia; Taiwan; Thailand; Vietnam |
Africa; Asia; Eastern Europe excluding Russia; Eurozone Large Cap; Eurozone Small Cap; Latin America; Middle East & North Africa; Nordic Countries Large Cap; Nordic Countries Mid & Small Cap |
On 2017q1, Nordic Countries Large Cap replaced Portugal
On 2022q2, USA Large Cap Growth, France Mid & Small Cap and Nordic Countries Mid & Small Cap, replaced Malaysia, Turkey and Russia
On 2022q2, USA Large Cap Growth, France Mid & Small Cap and Nordic Countries Mid & Small Cap, replaced Malaysia, Turkey and Russia
Top choice of EBI (return and actual ranking)
Country/region ranked first by EBI, its return and actual ranking among 41 countries/regions
Period |
Country / Region |
Return (%) |
Ranking |
2015q4 2016q1 2016q2 2016q3 2016q4 2017q1 2017q2 2017q3 2017q4 2018q1 2018q2 2018q3 2018q4 2019q1 2019q2 2019q3 2019q4 2020q1 2020q2 2020q3 2020q4 2021q1 2021q2 2021q3 2021q4 2022q1 2022q2 2022q3 2022q4 2023q1 2023q2 2023q3 2023q4 2024q1 2024q2 |
Indonesia Brazil Brazil Brazil Portugal Italy China Russia China Brazil Norway Norway Turkey Thailand Turkey Eurozone S Cap USA S Cap Denmark Eurozone L Cap Indonesia Indonesia Indonesia Austria Turkey Turkey Brazil India Nordic M&S Cap Nordic M&S Cap Nordic M&S Cap France M&S Cap Spain Indonesia Germany L Cap MENA |
21.2 19.2 15.3 10.6 4.3 9.0 2.2 11.8 5.9 6.6 12.0 6.1 4.5 9.4 2.0 -2.0 5.6 -16.8 15.9 -9.3 27.2 -2.0 8.9 3.8 -8.4 32.9 -7.8 -12.2 8.6 1.4 1.0 0.0 -5.6 7.5 -1.8 |
1 1 1 7 20 11 18 2 10 2 2 3 4 25 21 37 22 5 22 39 2 38 9 10 41 1 13 38 16 26 20 14 39 12 30 |
Note: Returns in € obtained from Morningstar
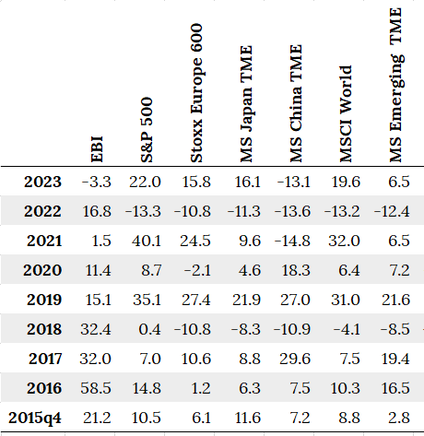
Comparison with benchmarks
Returns in euros (%)
Alpha, beta and summary statistics
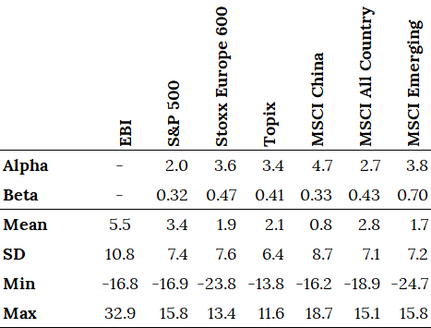
Alpha and beta of EBI relative to benchmarks. Estimates obtained from quarterly returns in € since 2015q4.