Evidence-based investing (EBI)
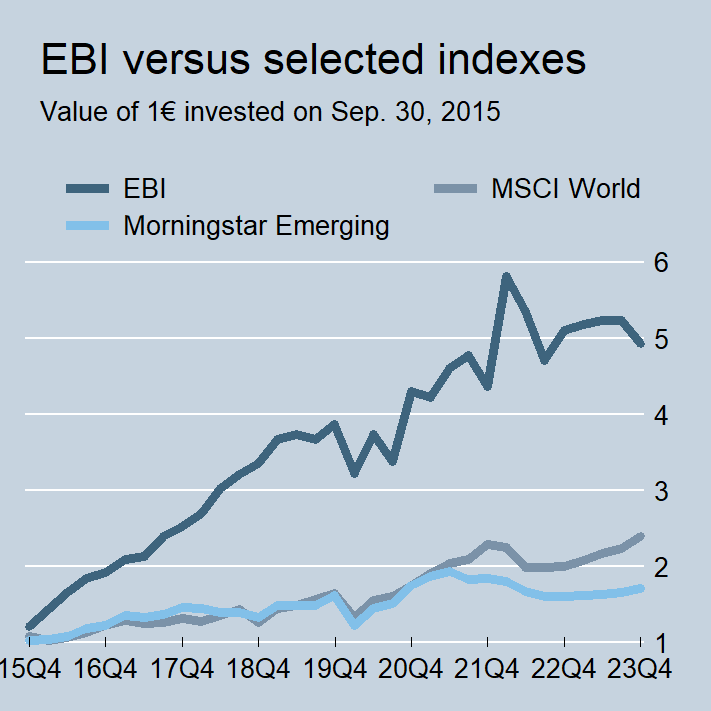
Evidence-based investing consists in a series of rules based on public information that rank countries according to their likelihood of being "good" investment options in any given quarter. The mean annual return of countries ranked first by EBI over the 2015 Q4 - 2023 Q4 period is 21.4%. Find out more about the sample of countries used in the analyses and the performance of EBI.
As in any investment decision, risk considerations are a fundamental part of EBI. Statistical methods are used to assess risk. It is found that the probability of having a negative return over a year is 10.8%.
At the beginning of every quarter, the two best countries or regions to invest according to EBI (out of 41 Morningstar categories) and those ranked last are shown in the table below.
At the beginning of every quarter, the two best countries or regions to invest according to EBI (out of 41 Morningstar categories) and those ranked last are shown in the table below.
Period |
Best Options |
Worst Options |
2024 Q1 |
Germany Large Cap (12) Switzerland M&S Cap (34) |
Nordic Countries M&S Cap (22) Sweden (22) |
2024 Q2 |
Middle East and N. Africa (30) Nordic Countries M&S Cap (7) |
USA Large Cap Growth (14) Vietnam (36) |
2024 Q3 |
Vietnam Middle East and N. Africa |
Norway India |
Best and worst investment options according to EBI (actual ranking among 41 countries/regions in parenthesis)